In the technical analysis chapter, you have studied practical technical templates – let’s place them into an intraday context and call them Trades. Your executions will be compiled from a Bigger Picture (market environment), a Catalyst (news), a Setup (stock’s longer-term picture), a Trade (stock’s intraday picture), and a Tape (time and sales prints). In this article, let’s take a look at intraday trade examples only. We’ll review two very common trades: Level Breakout and VWAP Continuation.
Level Breakout
A) Mobileye Global Inc (Auto parts, USA) broke $15 resistance (which coincided with intraday high) on 30jan2025
MBLY gapped down on an average earnings report (MBLY Mobileye Global beats by $0.02, beats on revenue; guides FY25 revenue below consensus), but found a bid in pre-market and developed levels at $15, $14.5, $14, and $13.5. Let’s take a look at the pre-market intraday chart:
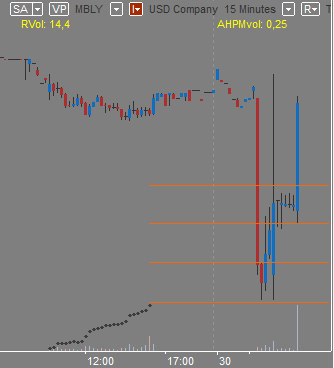
The stock was holding $14.5 in the pre-market before the open, and after the open, it started making higher lows toward the $15 resistance. Take a look at the intraday chart:
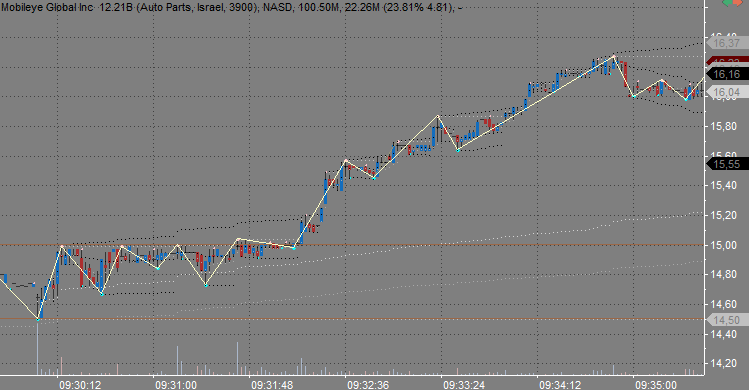
Notice that the real market picture is almost always noisier than what we saw in the practical trading templates. Here, MBLY attempted to go lower but couldn’t even hold below VWAP from the open (white dotted line) and instantly moved to test the $15 resistance again. Then, the $15 seller lifted to $15.04, but buyers never dropped the $14.90 bid and eventually lifted bids to $14.98. Finally, the seller lifted, and the stock moved up to $16.16 on huge relative volume. Note that the stock had room to run – the closest resistance (gap fill in this case) was far from the breakout level.
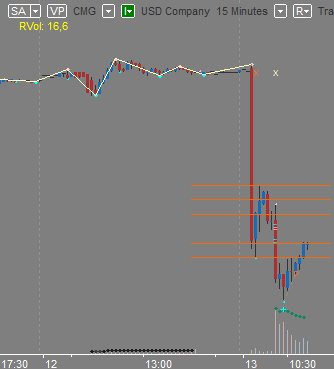
B) United Parcel Service Inc. (Shipping and Logistics, USA) broke the $113 support (which coincided with the intraday low) on 30jan2025
We studied the UPS breakout setup in a previous article about setups. Now, let’s take a look at the breakout trade. The stock tanked after a bad report (UPS beats by $0.22, reports revs in-line; guides FY25 revs below consensus). Take a look at the pre-market intraday chart one more time:
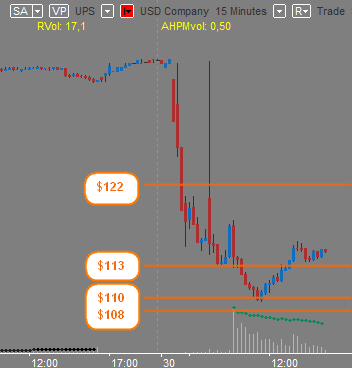
Note the $113 level, and let’s take a look at a lower timeframe:
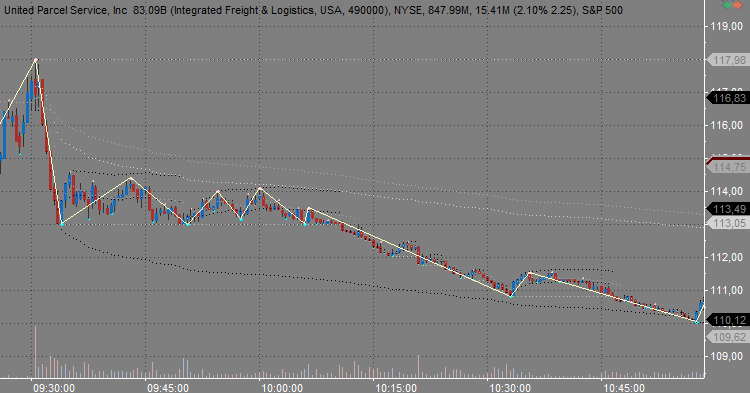
After the open, the stock dropped $5—from $118 to $113—and never retraced more than a buck and a half from that support. Note that it’s also noisier than a theoretical descending triangle or clean lower highs into support. But despite that, you could feel the selling pressure, and the stock was getting tighter and tighter around $113. Later, at 10:11, it broke down and dropped to $110 on huge relative volume. Note that the stock had room to move—the closest support was far from the breakout level.
VWAP continuation
A) Chipotle Mexican Grill (Restaurants, USA) retraced to VWAP on 04aug2024
CMG gapped down on news (CMG filed a Current Report on Form 8-K disclosing the departure of long-time CEO Brian Niccol and the appointment of COO Scott Boatwright as interim CEO). Take a look at the pre-market intraday picture:
Stock levels were $49.5, $50, $51.5, $51, and $52. Now, take a look at the intraday price action, where you will see how, after the open, the stock cleared the $51 level and tried to hold it twice in the first couple of minutes but failed and slipped to $50 on big volume:
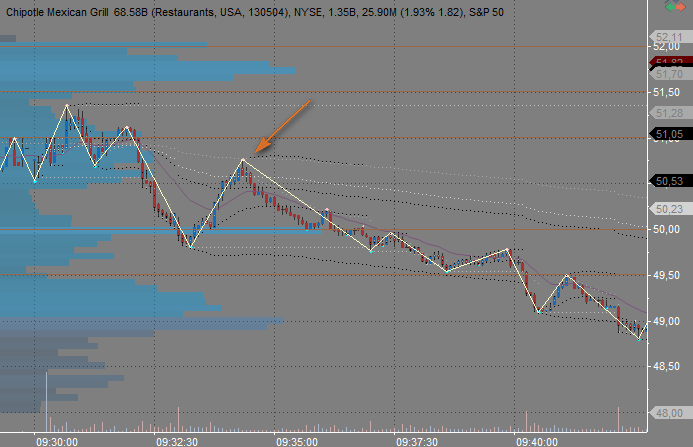
After that, the stock retraced to the intraday VWAP (grey dotted line) just to continue the downmove. Note how the retracement had less and less volume. After the stock broke that retracement, it dropped to $48.5 on huge relative volume. Note that the stock had room to move—the low of the day and the $50 support offered a good risk-to-reward opportunity.
B) Hims & Hers Health Inc (Household & Personal Products, USA) retraced to VWAP on 29apr2025
HIMS gapped up on news (NVO & HIMS announce a long-term collaboration designed to make proven obesity care and treatments more accessible). Take a look at the pre-market intraday picture:
Levels were $30, $33.5, $37, $38, and $43. After testing $43 several times, the stock started to hold significantly lower at around $37, then tried to hold $38 but failed right before the open. On the open, it established a downtrend to the $35 area. Take a look at the intraday chart:
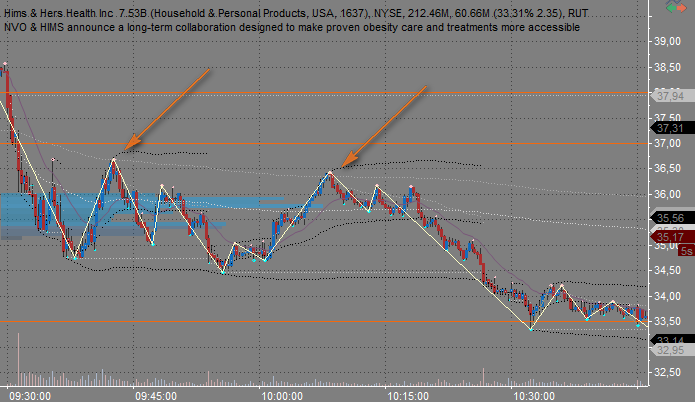
Then, the stock gave two pretty good entries retracing to VWAP. Note how these entries were below the $37 and $38 pre-market levels, giving us more confidence. Also, note that the stock had room to fall—the next $33.5 level was far away, offering a good risk-to-reward opportunity.
Combining these two trades with the two setups from the prior article will give you four playbooks to start with:
- Gap Break out – Level Break out
- Gap Break out – VWAP Continuation
- Gap into Level – Level Break out
- Gap into Level – VWAP Continuation
When you collect 5-10 examples for each playbook, you will be able to trade them with more confidence. After 10-20 examples, you’ll become more advanced in trading them, understanding when to press size, when to scale out, and when a trade is not working so you can cut it earlier, etc.
gl hf