In the intricate world of global finance, institutional investors – such as pension funds, BlackRock, Vanguard, Fidelity and sovereign wealth funds – are pivotal in shaping market dynamics. Their investment decisions, often amounting to billions, are influenced by a complex interplay of economic indicators, geopolitical events, and market sentiments. Understanding how portfolio managers of these entities navigate periods of uncertainty provides insight into broader market behaviors, because this money is what actually moves the markets.
Uncertanty
The COVID-19 pandemic in early 2020 presented an unprecedented challenge. With limited information about the virus’s spread and impact, markets reacted swiftly. The S&P 500 dropped approximately 34% from its peak in February to its trough in March 2020.
Institutional investors faced dual pressures: managing client redemptions and reassessing portfolio risks in a rapidly changing environment. Many engaged in a “flight-to-quality,” moving capital into more stable assets like government bonds or high-quality equities. Interestingly, stocks with higher institutional ownership underperformed during this period, suggesting that large-scale repositioning by these investors contributed to the downturn.
However, as governments and central banks worldwide implemented stimulus measures and provided clearer guidance, investor sentiment began to shift. The realization that the pandemic, while severe, could be managed led to a rapid market recovery. By August 2020, the S&P 500 had regained its pre-pandemic levels, exemplifying a V-shaped recovery.
The initial panic was less about tangible economic damage and more about uncertainty. Once a path forward became evident, confidence returned, and markets rebounded.
In early 2025, President Donald Trump announced sweeping tariffs, including a 145% levy on Chinese goods and 25% tariffs on imports from key allies like Canada and Mexico. This abrupt policy shift introduced significant uncertainty into the markets, leading to a massive sell-off. The S&P 500 plummeted over 10% in just two days, erasing $4 trillion in market value.
Institutional investors, managing vast portfolios, are particularly sensitive to such uncertainties. The lack of clarity around trade policies made it challenging to price risk and make informed investment decisions. As a result, many institutions adopted a risk-off approach, reallocating assets to safer investments (like gold) or holding cash, exacerbating the market downturn.
This episode underscores a fundamental principle: markets are not solely driven by economic fundamentals but by the perception and sentiment of investors towards those fundamentals. When policies introduce unpredictability, even in a strong economic environment, markets can react negatively.
Framework
Key points that will help you understand what kind of market you are in:
- SPX 10SMA > 20SMA and SMAs are heading higher – good frame of reference to think we are in a bull market
- SPX 10SMA < 20SMA and SMAs are heading lower – good frame of reference to think we are in a bear market
- In a bull market: good news is good news, bad news is good news- usually, bad numbers in CPI/PMI/Fed/PCE/ISM/GDP/etc. news are bought within a day or two after the initial negative reaction.
- If you see bad news being sold off – it indicates a shift in the psychology of market participants to the bearish side
- In a bear market: good news is bad news, bad news is bad news – usually, good numbers in CPI/PMI/Fed/PCE/ISM/GDP/etc. news are sold off within a day or two after the initial positive reaction.
- If you see bad news being bought – it indicates a shift in the psychology of market participants to the bullish side
- Compare risk-on and risk-off ETFs performances to see where moneys are flowing
- Risk-on ETFs:
- XLK (technology)
- XLY (consumer discretionary – people avoid to buy new cars or upgrade computers in bad economic situation)
- ARKK (or another growth fund like VUG or SCHG – high-risk, high-reward asset)
- Risk-off ETFs:
- XLU (utilities – people always need electricity and water in their houses)
- XLP (consumer staples – people always need to buy food)
- XLV (healthcare – people always need drugs and medical services)
- GLD (gold – has always been a safe haven especially when money printer go brrr)
- Use thematic ETFs to gain insights:
- UUP (dollar – might go down if there is a threat to the U.S. economy relative to the economies of other countries)
- TLT (bonds – essentially a risk-off asset; capital flows into bonds during equity sell-offs)
- USO (Oil – our entire civilization is based on oil nowadays. Higher oil prices increase inflation and lead to higher prices for almost everything, from fertilizers and packaging to travel and steel)
- SMH (semiconductors – they are the backbone of the modern economy; they power AI, cloud computing, cars, industrial machinery, phones, and defense. If chips become scarce, many goods cannot be produced on time at all)
- $VIX (it is better to use the $VIX indicator, not an ETF like VXX or UVXY, to see what S&P 500 volatility the market expects)
- WEAT (It is better to use wheat futures, not an ETF. Grain prices nowadays are usually not very volatile due to farming and fertilizer technology, but let’s leave it here so you remember that in human history, grain shortages were sometimes so severe that prices spiked by over 600%)
- Risk-on ETFs:
Examples
Let’s review some markets so you can understand, through real-world examples, how to make this analysis by yourself.
Bear market, spring 2025
Take a look at the SPY chart — the sell-off started in mid-February 2025, caused by anticipation of trade wars in 2025. You can clearly see that the bear market started well before Trump held the press conference with that reciprocal tariffs table on the 2nd of April, 2025.
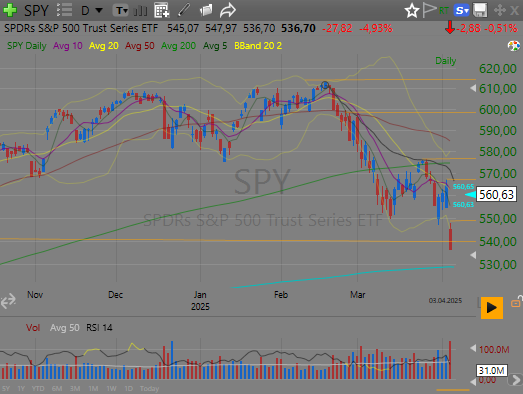
Note how the 10SMA is below the 20SMA, and both are heading down during the sell-off. But the psychology of big portfolio managers shifted to a more defensive state even before mid-February. Note how SPY made a new all-time high in December, then in mid-January, and then in mid-February.
Now compare consumer discretionary and consumer staples:
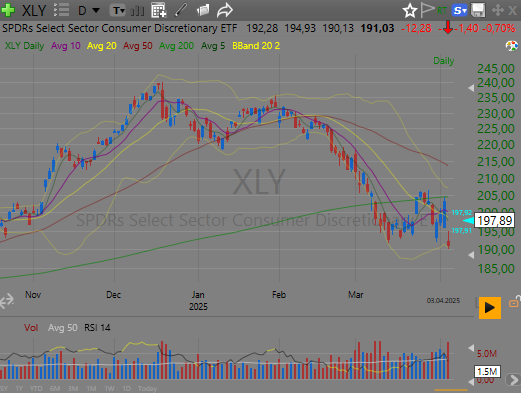
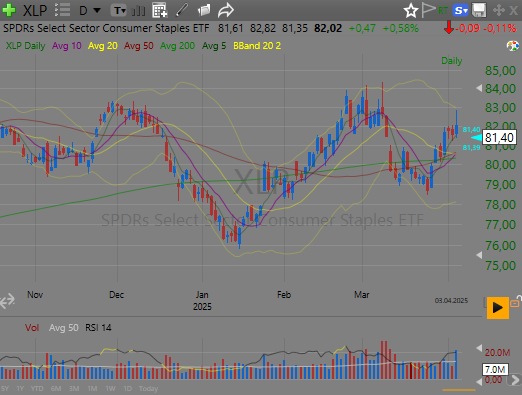
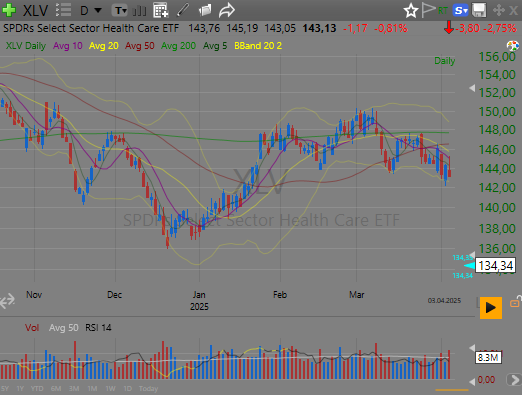
You see how consumer discretionary, which usually outperforms SPY and XLP in a bull market, made a new lower high in February. And when XLY sold off in February, XLP was bought, and even made a higher high at the end of February. That indicates that big money is flowing into defensive assets within the consumer sector. Healthcare also cleared the December highs — and even earlier, in late January:
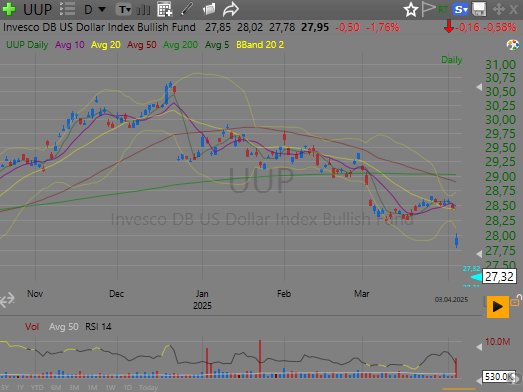
Now let’s take a look at the dollar index and gold. This -4% move in UUP on December 23, 2024, is just an ex-dividend event, which happens once a year in late December. Imagine there is no gap there — look at how the dollar was not able to make a new high in February and was selling off, indicating that big funds thought the tariff wars might bring weakness to the U.S. economy.
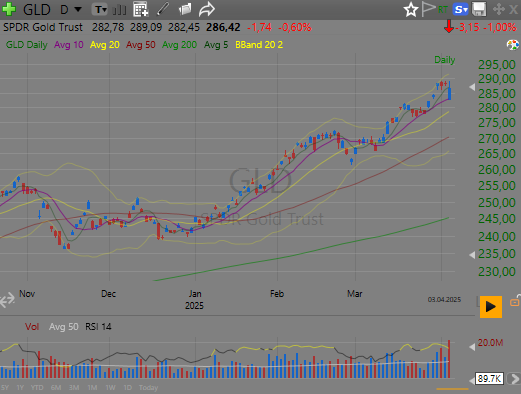
Meanwhile, gold was super strong.
Now imagine someone having a long bias on NVDA during this sell-off in the markets. It was the number 1 stock at that time, posting 70% YoY revenue gains each quarter, but it still lost half of its value. People would lose money playing long, because the psychology of big portfolio managers at that moment was not to earn, but rather to preserve — shifting money to cash or into safer assets (of course, when a truly devastating bear market sets in, all assets — whatever they are — lose value, but some lose less than others in percentage terms).
Back to the bull market, spring 2025
Let’s review how we got back to the bull market after the tariff wars.
By the end of April, we were still in a higher-volatility environment, with people talking about tariff uncertainty. Take a look at SPY:
… LOG IN or SIGN UP (free) to see the rest of the content.