In the previous article, you learned a lot about after-hours and pre-market price action and how to combine this price action with higher timeframe levels – let’s call this combination a Setup. When building your playbook, you should give names to these setups so you can internalize them more quickly. Let’s review two very common setups: Breakout and Gap into Level.
Breakouts
A) Dutch Bros Inc (Restaurants, USA) reported earnings on 06nov2024
BROS Dutch Bros beats by $0.04, beats on revs; raises FY24 revenue and same shop sales growth guidance.
Co Reports Q3 (Sep) earnings of $0.16 per share, excluding non-recurring items, $0.04 better than the FactSet Consensus of $0.12; revenues rose 27.9% year/year to $338.2 mln vs the $324.97 mln FactSet Consensus.System same shop sales and transactions increased 2.7% and 0.8%, respectively, relative to the same period in 2023. Company-operated same shop sales1 and transactions increased 4.0% and 2.4%, respectively, relative to the same period of 2023.Co raises guidance for FY24, sees FY24 revs of $1.255-$1.260 bln vs. prior guidance of $1.215-$1.230 bln, above the $1.23 bln FactSet Consensus. Same shop sales growth for 2024 is expected to be approximately 4.25%, from low single digits previously. Same shop sales growth for the fourth quarter of 2024 is expected to be between 1% and 2%. Total system shop openings in 2024 are now expected to be 150, consistent with the previously communicated outlook at the lower end of 150 to 165.
This is good news – EPS was up +33%, revenue +4%, and full-year guidance for revenue was declared to be +3%. Same-store sales growth guidance is very important for restaurants. No wonder the stock gapped up and broke out of important levels. Look at the daily chart:
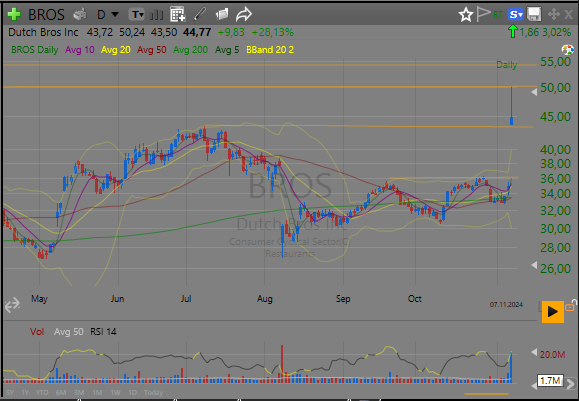
The stock not only broke out of the $36 resistance, which was the high from the prior report in August, but also broke out of $43.5, which was the high from the May report. In this case, we need to look back even further to understand if there are important higher timeframe levels:
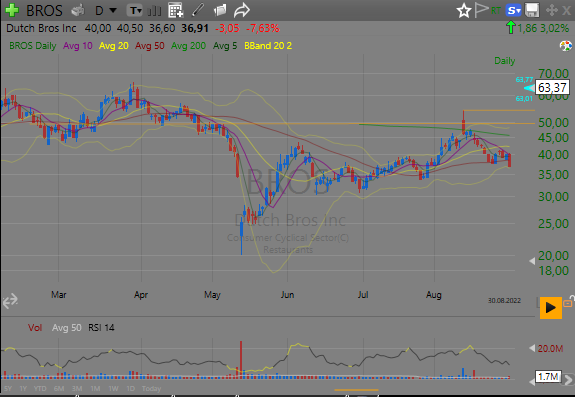
We scrolled back to 2022 to see when the stock was trading at these $45-ish levels. We see that the August high was $55, but we also observe that the stock was around the $50 level in March. Then, $50 acted as support in April and later as resistance in early May. Additionally, $50 is a significant psychological level between $10 and $100. Let’s take a look at the intraday price action:
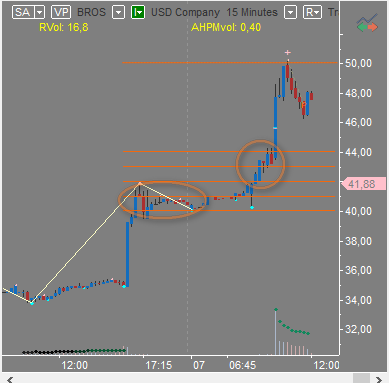
We see the stock gapped up, found resistance at $42, and found support around $40 in after-hours. The next day, it never traded below $40 and then started holding above $42 in pre-market—this is very bullish price action. It’s a strong sign when a stock trades above the after-hours high the next day; this is very good for long breakouts. The opposite is also true for shorts. In this example, the stock went right to the $50 level on huge relative volume.
B) United Parcel Service Inc (Shipping and Logistics, USA) reported earnings on 30jan2025
UPS UPS beats by $0.22, reports revs in-line; guides FY25 revs below consensus
Co Reports Q4 (Dec) earnings of $2.75 per share, excluding non-recurring items, $0.22 better than the FactSet Consensus of $2.53; revenues rose 1.5% year/year to $25.3 bln vs the $25.41 bln FactSet Consensus. Consolidated Operating Margin of 11.6%; Non-GAAP Adjusted Consolidated Operating Margin of 12.3%. Co issues downside guidance for FY25, sees FY25 revs of ~$89 bln vs. $95.03 bln FactSet Consensus. Operating margin to be approximately 10.8%. Today the company announces the following set of strategic actions: First, it has reached an agreement in principle with its largest customer to lower its volume by more than 50% by the second half of 2026; Second, effective January 1, 2025, the company has insourced 100% of its UPS SurePost product; And third, in connection with these efforts, the company is reconfiguring its U.S. network, and launching multi-year “efficiency reimagined” initiatives to drive approximately $1.0 billion in savings through an end-to-end process redesign. The company is planning capital expenditures of about $3.5 billion, dividend payments of around $5.5 billion, subject to board approval, and share repurchases of around $1.0 billion for 2025.
This is bad news – the company beat EPS by +9%, but revenues were in line, and more importantly, it guided full-year revenues down by -6%. Let’s take a look at the daily chart:
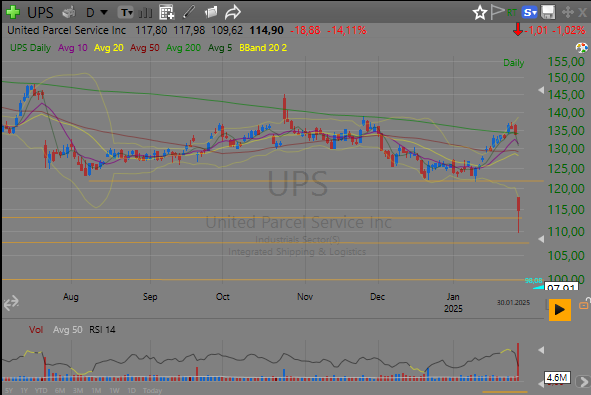
The stock broke the $122 support, so we need to look back to understand if there are important higher timeframe levels:
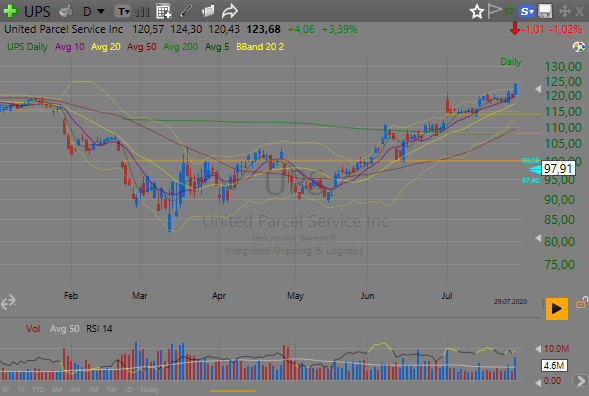
The last time the stock was trading at these $115-ish levels was back in 2020. We see that after a gap up in July, the stock slipped to $114 and never traded below $113. We also see the resistance that became support at $107-108, and we notice a stronger level at $100, which is also significant from a psychological standpoint. Let’s take a look at the intraday chart:
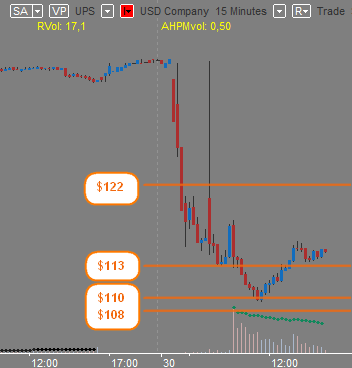
Since the report was released in pre-market, there was little to no after-hours price action. In pre-market, we see that the stock broke through the $122 level and then found support at $113. After that, the stock didn’t break the pre-market downtrend, which is bearish, and when the market opened, it found support at $113 again. However, within 30 minutes, the $113 buyer dropped, and the stock slipped to $110 on huge relative volume.
These breakouts in BROS and UPS are very good examples of what you should look for when searching for breakout setups as a newbie – clear good or bad news, higher timeframe levels being broken (so the crowd wants to get in or get out), and intraday price action confirming that the breakout is working.
Gap into Level
A) Chipotle Mexican Grill (Restaurants, USA) reported earnings on 04feb2025
CMG Chipotle Mexican Grill beats by $0.01, reports revs in-line, comps +5.4%, guides to FY25 comp growth in the low to mid-single digits
Co Reports Q4 (Dec) earnings of $0.25 per share, excluding non-recurring items, $0.01 better than the FactSet Consensus of $0.24; revenues rose 13.1% year/year to $2.85 bln vs the $2.85 bln FactSet Consensus. Comparable restaurant sales increased +5.4%. CMG
said on its Q3 call that it expected Q4 comps to modestly accelerate from Q3’s +6.0% comp, but they were a bit lower. Comps for Q4 were driven by higher transactions of +4.0% and a +1.4% increase in average check. Digital sales represented 34.4% of total food and beverage revenue. 2025 Outlook: Co guides to comp growth in the low to mid-single digits. Co reaffirms guidance for 315-345 new company-owned restaurant openings with over 80% having a Chipotlane.
This is pretty average news – EPS was +4%, revenues were in line, comps (same-store sales) were +5.4%, but the guidance is for low to mid-single digits, which is lower than the current 5.4%. They reaffirmed new openings. Lower comp guidance is not ideal, but it’s not catastrophic. Let’s take a look at the daily chart:
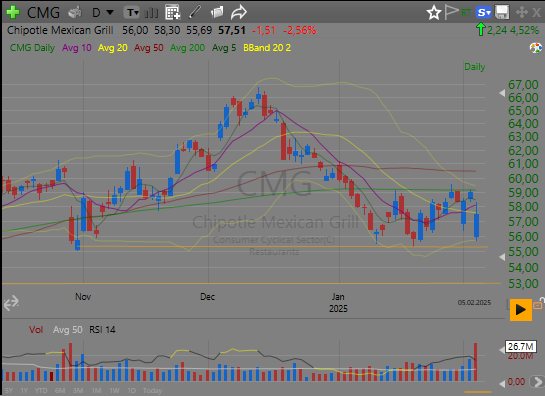
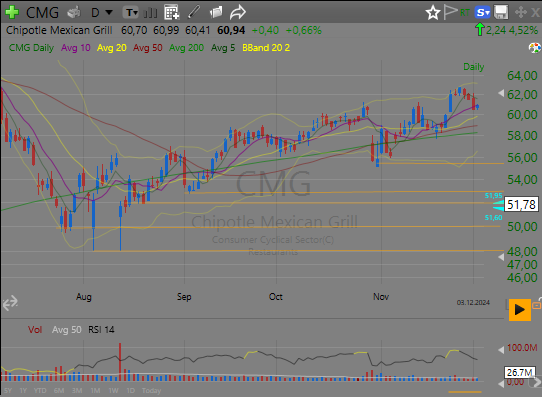
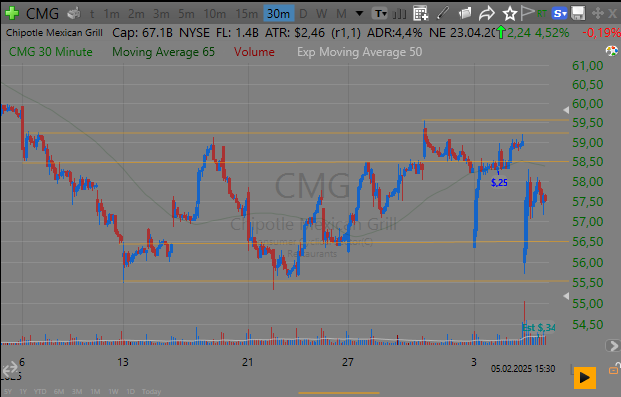
The stock gapped -5% to the $55.5 support. In this case, we need to look back to identify potential supports if the stock breaks this $55.5 level intraday. We also need to look at lower timeframes to study the $55.5-$59.50 range and be aware of resistances if the stock holds that $55.5 support. First, let’s look back on the daily chart:
We see that the next supports are $53, $52, $50, and $48 from 2024. Now, let’s look at the lower timeframe and study the range:
We see that the support levels in the range are $55.5 and $56.5, and the resistance levels are $59.5 and $58.5. There is also a $57.5 level right in the middle of the range. Let’s look at the intraday price action:
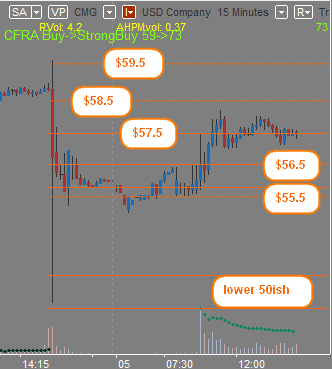
After the news, the stock slipped to the lower $50ish support in after-hours, then retraced to the $57.5ish resistance and found a bid at $55ish. The next day, in pre-market, the $55ish bid held and developed more clear support at $55.5-$55.75, with resistance at $56.5. If the stock doesn’t hold lower the next day, it should alert you that it’s possible for the stock to hold that $55.5-$55.75 support and may try to fill the gap. That day, the stock made what’s called a soft gap fill (when the stock fills the gap to the prior day’s bar’s high/low price, not to the bar’s close price), with good relative volume.
B) News hit Palantir Technologies Inc (Software, USA) on 14apr2025
Nato acquires AI military system from Palantir
Financial Times: Nato has acquired an artificial intelligence-powered military system from Palantir, the US software company chaired by Donald Trump-backer Peter Thiel and with strong Pentagon connections. The alliance’s choice comes amid rising anxiety among European members over a potential US withdrawal after Trump threatened to stop protecting the continent if capitals did not drastically increase defence spending. Nato is also racing to keep up with the development of rivals’ AI military capabilities such as China. Palantir’s Maven Smart System (MSS Nato) uses generative AI, machine learning and large language models to provide “commanders with a secure, common operational capability” and will be used to support Nato operations, the alliance said on Monday. Such “battle space management systems” allow 20-50 soldiers to do the work sifting through battlefield data that teams of hundreds or even thousands did in recent conflicts such as Afghanistan and Iraq.
This is good news for Palantir, but not very outstanding news—the company already supplies the US government with its software. Palantir has won more than $2.7 billion in US government contracts since 2009, including more than $1.3 billion in the Department of Defense, according to federal records. Investors expect the company to benefit from the Trump administration’s defense spending as well as commercial clients using its AI systems. Let’s take a look at the daily chart:
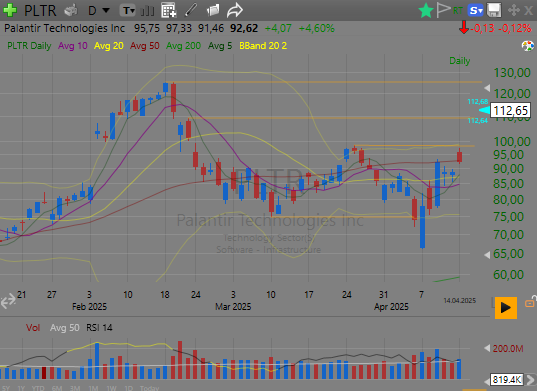
We see that the stock gapped up to $96, and we have $98 resistance developed in May. Now, let’s look at the lower timeframe to study the range the stock has been trading in for a while:
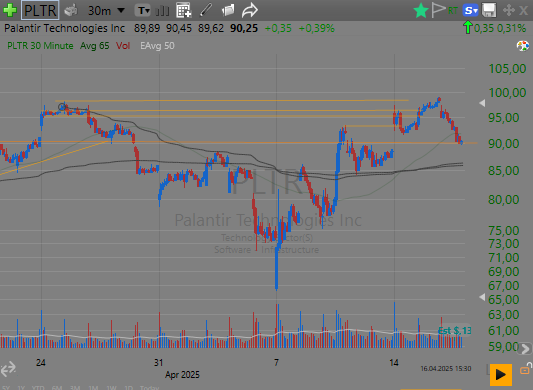
We see that the stock has $98, $96, $95, $93, and $90 levels that we should be aware of. Now, let’s look at the intraday price action:
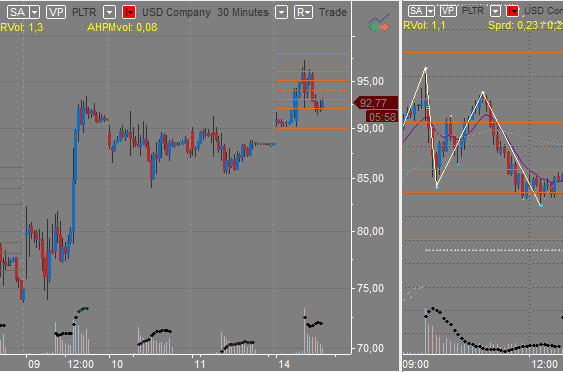
We can add the $92 level—it spiked to this level twice in prior days, and today in pre-market, it found some resistance there. The stock didn’t make much volume in pre-market, and its relative volume was not very high (partly due to the huge volume the stock typically trades on, partly due to the market being very active because of Trump tariffs and partly due to the news not being that breaking). So, PLTR opened at a high of around $95, found support at $95, and tried to move up, but failed at $97.3 and slipped to $92. It then went up to $96 and slipped again to $92.
These Gap into Level examples are pretty good—there were news to provoke the gap, but the news did not fundamentally change the state of affairs. So, stocks gapped to key levels and held them.
gl hf